
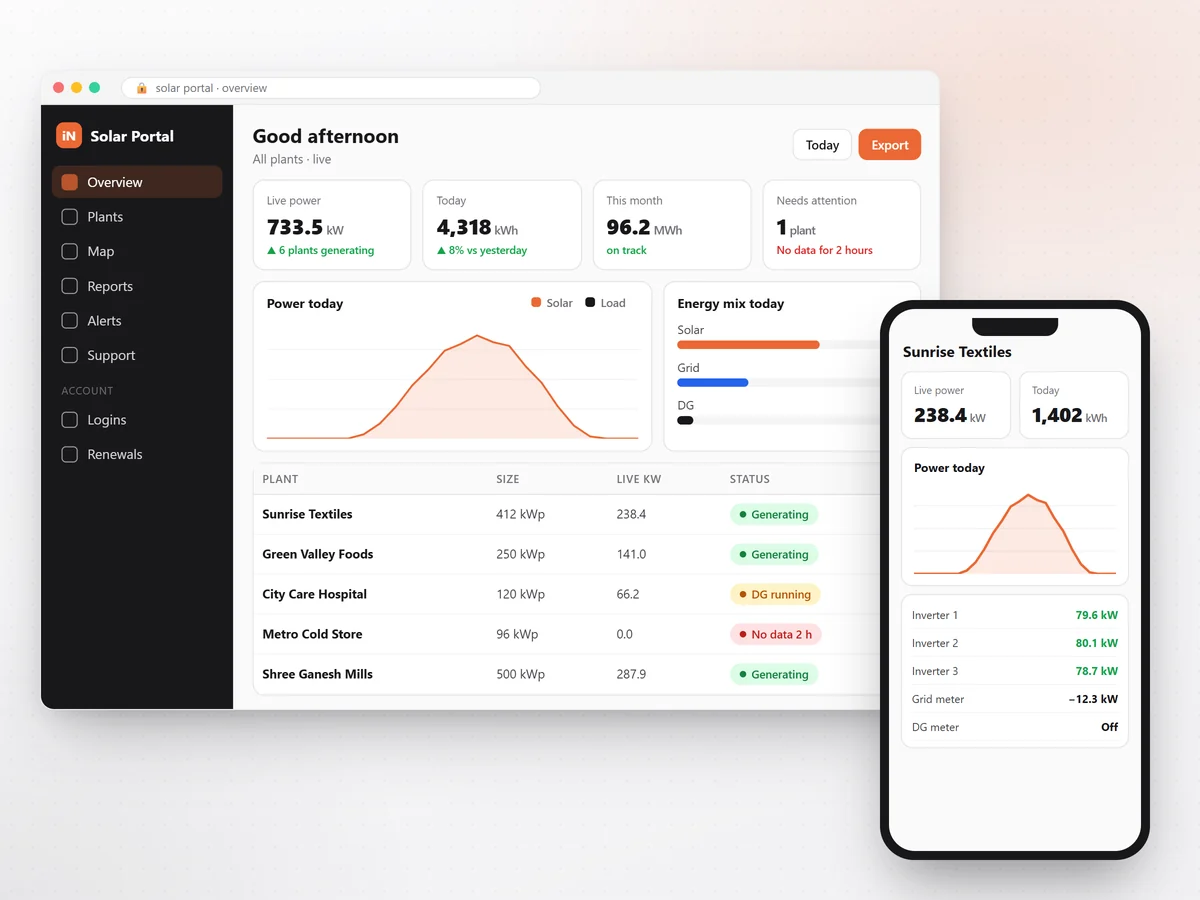
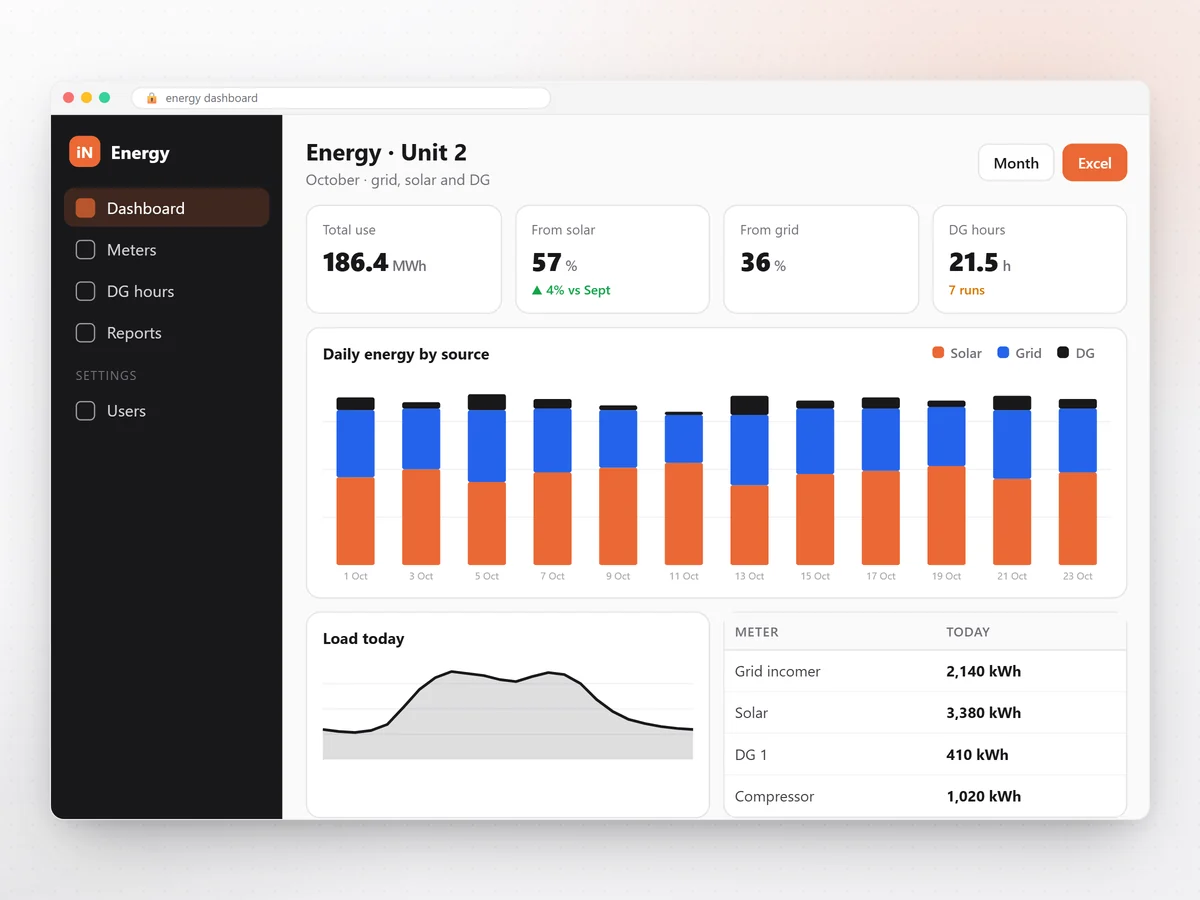
Screens are shown with sample data; your own screens show your business.
Energy Monitoring Dashboards
Know where your energy goes
See where every unit goes: grid, solar and DG side by side, by day, month and year.
- Clear proposal with GST
- Hosted and backed up by us
- Setup and training included
Key points
- Grid, solar and DG on one screen
- Daily, monthly and yearly totals
- DG running hours
- Load through the day
Overview
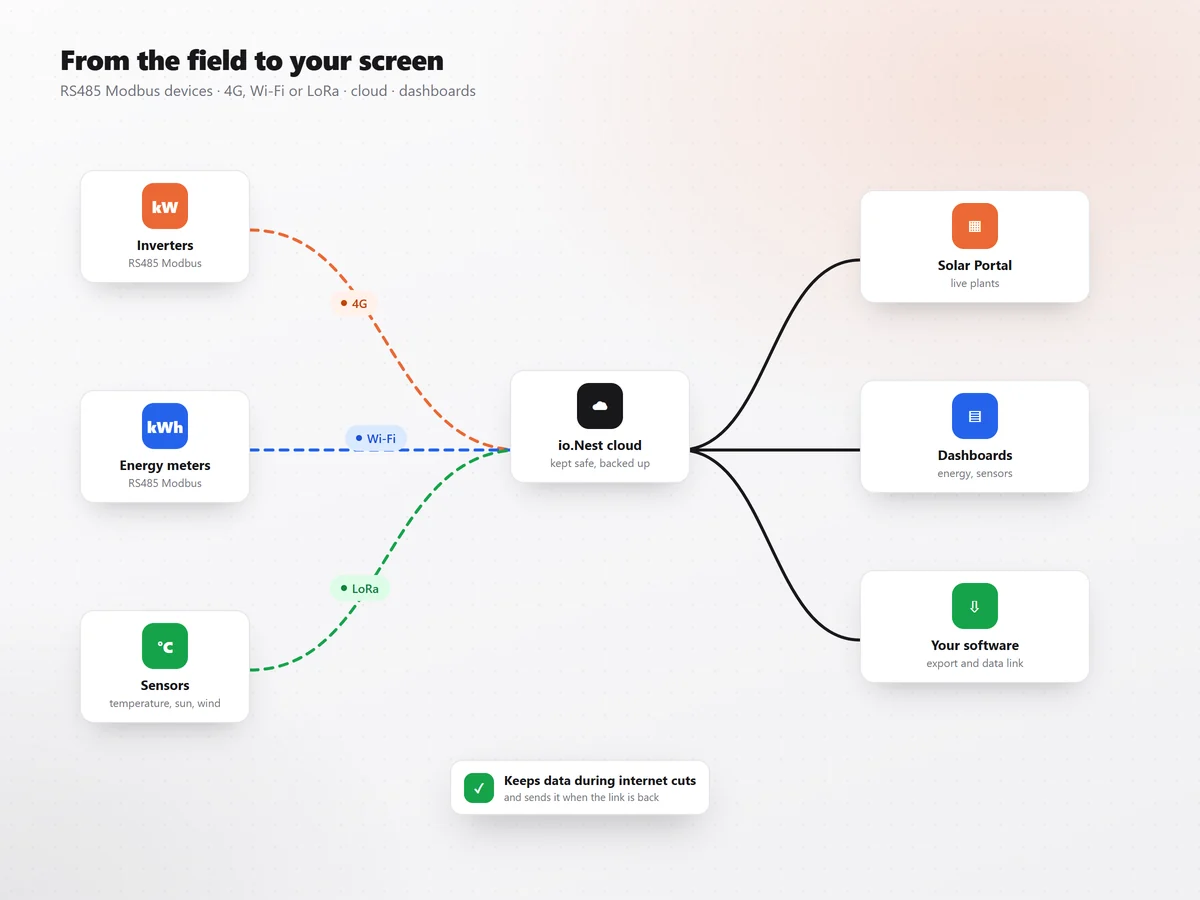
Smart meters at the grid, solar and DG points send their readings to one dashboard. You see how much each source gave, when the load peaks, and how many hours the DG ran.
Useful for factories that want to cut diesel and grid bills, and for building owners who split energy between tenants or departments.
Features
- Grid, solar and DG on one screen
- Daily, monthly and yearly totals
- DG running hours
- Load through the day
- Export to Excel
- Works with Modbus energy meters
Specifications
| Data from | Modbus energy meters through io.Nest devices |
|---|---|
| Views | Live, daily, monthly, yearly |
| Exports | Excel, CSV |
Need a detail that is not listed here? Ask us and we will confirm it for your site.
Where to use it
- Factories and plants
- Commercial buildings
- Campuses and institutions
Related
Goes well with
Get a quote
Tell us what you want to build
Plant monitoring, billing, a website with an admin panel, or software only your business needs. Tell us in a few lines and we send a clear proposal with GST.